Statistics and KPI
Table of contents
Introduction
Because Ongoing WMS keeps track of every warehouse transaction, it is possible to compute various statistics, measures or Key Performance Indicators (KPI). You may wish to see how many orders have been picked in total for a particular goods owner, or how many orders a particular user has picked, or how many items have been received during a period. Combine your indicators to improve your business. In this text you get an overview about what Ongoing WMS offers.
The statistics pages are accessed using the Statistics menu:
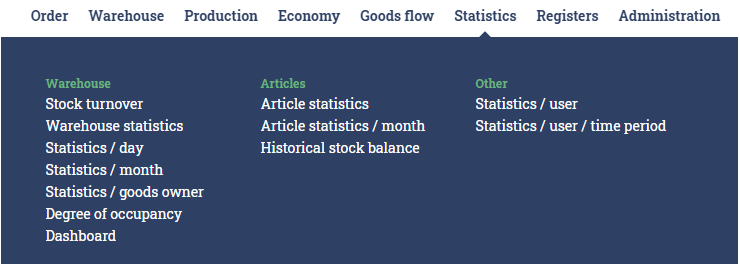
Some pages compute the statistics for an entire period, while others display the statistics on a daily, weekly or monthly basis. Some display several statistics at once, while others display only a single statistic at a time. Note: for many of these pages you can change what statistic measures to show, by clicking on the settings cog and changing what columns to show.
Warehouse
The submenu Warehouse contains the following pages. They contain statistics which are related to the entire warehouse or to the goods owners.
Stock turnover
Shows how many days each item in your warehouse has been in stock.
Warehouse statistics
Shows a selection of statistics, such as number of picked orders, for the current goods owner.
Statistics / day
Shows a selection of statistics for one or more goods owners. The statistics are displayed per day. The default statistics which are shown are:
- Number of shipped orders
- Number of shipped order lines
- Delivered quantity
- Number of purchase orders with inbound during period
- Number of purchase order lines
- Received article quantity
- Number of articles in stock
- Used warehouse locations
Statistics / month
Shows a single statistic at a time for one goods owner. The statistic is displayed per month. The default statistics which are available to select are:
- Received article quantity
- Number of purchase orders with inbound during period
- Number of purchase order lines
- Number of shipped orders
- Number of shipped order lines
- Delivered quantity
- Used warehouse locations
- Volume (m3) in stock
- Weight (kg) in stock
- Number of days goods have been in stock
- Number of unique serial numbers in stock
- Number of delivered pallets
- Inventory adjustments
- Number of movement order rows
- Invoiced amount
Statistics / goods owner
Shows several statistics for several goods owners. The statistics are displayed per goods owner. The default statistics which are shown are:
- Number of shipped orders
- Number of shipped order lines
- Delivered quantity
- Packed orders
- Number of purchase orders with inbound during period
- Received article quantity
- Invoiced amount
Degree of occupancy
This shows you what percentage of locations in your warehouse were used during a particular period.
Dashboard
This page can be configured to display various statistics, such as "Number of orders shipped today". It is mainly intended to be displayed on a fixed screen in an office or in the warehouse. Please contact Ongoing to set this up.
Articles
The submenu Article statistics contains statistics which relate to the articles of the current goods owner.
Article statistics
Shows article statistics for the articles of the current goods owner during a certain period. The statistics which are shown for each article are:
- Number of items picked for the article
- Number of orders picked which contain the article
- Number of order lines picked which for the article
- Number of picking occasions from any location
- Number of unique locations which the article has been picked from
- Picking frequency (which percentage of order lines are for this article)
Article statistics / month
Shows one statistic for the articles of the current goods owner. The statistic is displayed per month. The default statistics which are available to select are:
- Received article quantity
- Number of purchase orders with inbound during period
- Number of purchase order lines
- Number of shipped orders
- Number of shipped order lines
- Delivered quantity
- Delivered weight
- Packed orders
- Packed order lines
- Packed quantity
- Returned number of orders
- Returned number of order lines
- Returned number of items
- Quantity in stock
Historical stock balance
Allows you to see what quantity was in stock at a date in the past.
Other
Statistics / user
This page shows you what each user has done, in total, during a particular period. The values are computed either for all goods owners, or for a particular goods owner. The statistics which are shown by default for each user are:
- Number of shipped orders
- Number of shipped order lines
- Delivered quantity
- Packed orders
- Received article quantity
- Number of purchase orders with inbound during period
- Number of purchase order lines
- Returned number of orders
Statistics / user / period
This page shows you what each user has done, on a daily, weekly or monthly basis. The statistics which are shown by default for each user are:
- Number of shipped orders
- Number of shipped order lines
- Delivered quantity
- Packed orders
- Received article quantity
- Number of purchase orders with inbound during period
- Number of purchase order lines
- Returned number of orders
Examples
This section contains examples on how to obtain the following measures from Ongoing, over a desired time period: Number of shipped orders, Single product orders as a percentage of all orders and Average number of order rows per order.
Example 1: Number of shipped orders
To get the number of shipped orders for a desired time period, lets say a full year, there are two ways to do so, either in the submenu choice Statistics/Month or Statistics/Day.
In the first scenario Statistics/Month, there is a list of predefined statistics measures in the top dropdown menu, out of which Number of shipped orders is one. You can choose to show results for one specific goods owner, or all of them. Note that you will also have to define the out date of the order under Statistics config, in this case the date the order was picked. The result can look something like the below, with the sum for the full year 2024 to the far right:

Note the small down arrows in the results section, these are clickable and can give you more information about the orders for that month.
The second scenario, Statistics/Day, can be suitable if you wish to see also what days the orders were picked. In this scenario you will get 365 rows as result, for the full year of 2024. Note that you can choose to see results for all of your goods owners or just one.

The number of orders for the full year will be shown as a sum on the very bottom of the search results.
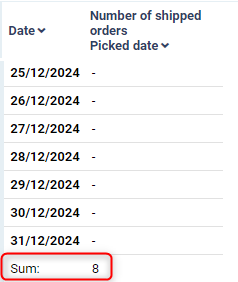
In this example the column Number of shipped orders was part of the default column view and was filtering orders based on their Picked date (same as in the first scenario above). To change the filtering method from Picked date to something else, the setting Columns have to be modified (see next example on how to do this).
Example 2: Single product orders as a percentage of all orders
In this scenario, the page Statistics/Day with some column modifications can be used. In the above example we have the result for total number of orders, so now we need to find out how large portion of those are orders with a single product on them. To do so, we define a new column called Number of shipped single-product orders that is the same as Number of shipped orders but has the additional requirement that it can only be one item on the order.
Click the settings cog in the lower left corner of the Statistics/Day page, and then edit the setting called Columns:

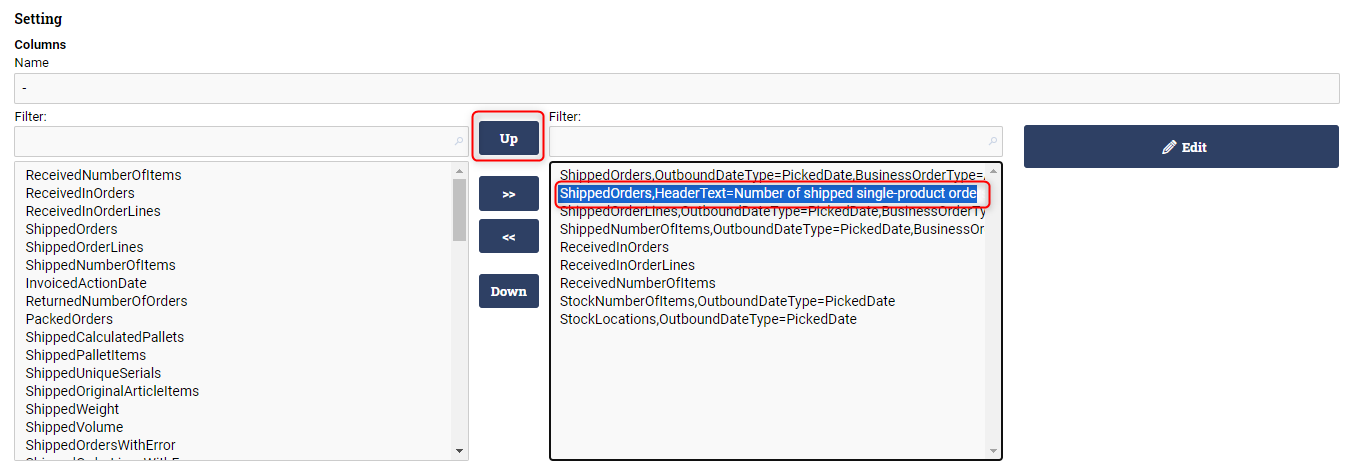
Here, select the ShippedOrders measure on the left and move it to the righthand side using the rightpointing arrow.
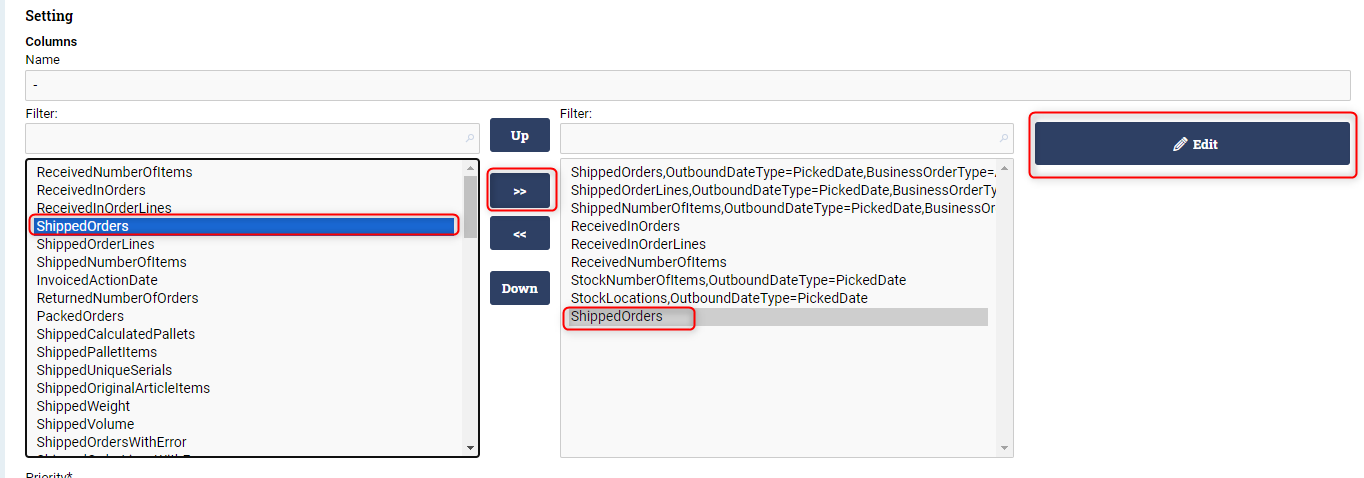
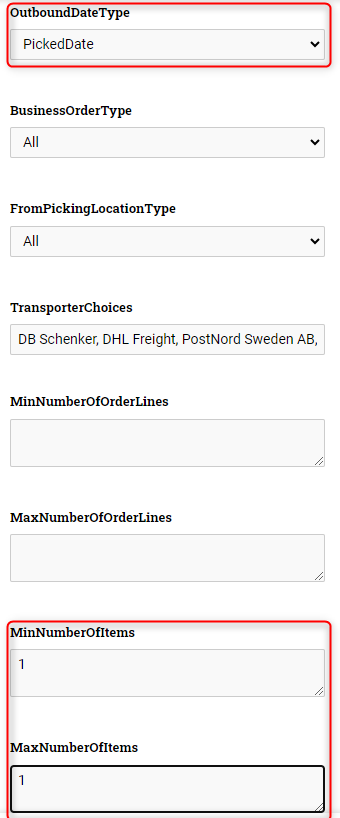
Now, select the ShippedOrders measure on the righthand side and click the Edit button. Here scroll down until MaxNumberOfItems is found and put a 1 there. Also put a 1 in MinNumberOfItems for the odd case that you have orders that are processed without items on them. Also, make sure that the value for OutboundDateType is the same as the other ShippedOrders measure, in this case PickedDate. If you wish to set a new name for your modified measure, change the field called HeaderText. In this case we call it "Number of shipped single-product orders".
After this, scroll down and click update on the righthand side to update the measure you just edited. You may then also want to move your new measure next to the other measure with shipped orders. This is done by selecting it and moving it with the Up button.
Finally, scroll down and update the setting on the Update button. Then go back to the Statistics/Day page and type in the time period, in this case the full year of 2024. Also select if the calculation should be done for all or just one goods owner.

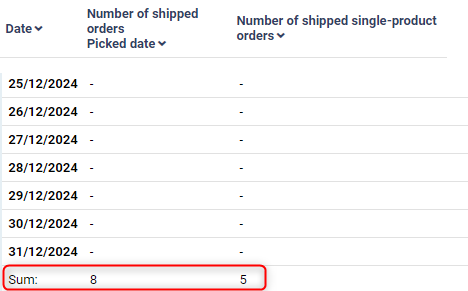
After clicking search, you will have the required values in the two leftmost columns, at the bottom of all 365 rows. In this case we got 5 single orders of a total of 8 orders, resulting in 63% of all orders being single product orders.
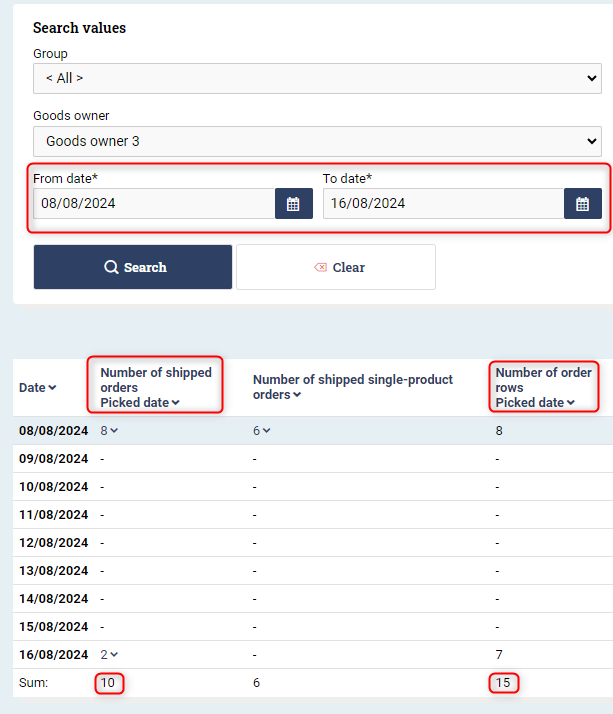
Example 3: Average number of order rows per order
This measure can be computed using both methods outlined in the examples above. On the Statistics/Month page, there are two predefined measures: Number of shipped orders and Number of order rows.

Simply compute these for the desired time period, look at the sum of both measures and divide Number of order rows with Number of shipped orders.
If a more granular time interval than per month is desired, it is possible to do the same calculation on the Statistics/Day page. To do so, simply choose one (or all) goods owner, select the desired time interval and look at the sums of the two default columns called Number of shipped orders and Number of order rows, and divide the two. Note that you can change the default "Picked date" to, for example, "Shipped date" by clicking the settings cog and editing the settings Columns.
